


**Work Completed By: Winston Castle **
DESCRIPTION
When investigating the impact of a distributed computing environment - that is the use of both private and public clouds - it is important to consider how management of such a physically separate architecture will be achieved. This is especially relevant if the services you provide as an organisation need to have Service Level Agreements (SLAs) assigned and the underlying infrastructure is not always provided internally.
One of the most apparent consequences is the increase in contract negotiations skills to cope with the potentially numerous cloud service providers. There is also a technical challenge, that of management information aggregation. How do we provide a single view of multiple infrastructure resources and link them through to the end service being offered by the organisation?
This project attempts to answer the technical question by investigating how, through the use of management application programming interfaces (APIs) and web services it is possible to present such information through a dashboard or portal view.
To achieve this, the project will attempt to create a dashboard that aggregates at least four infrastructure resource pools, covering areas such as storage, computing, and input/output (I/O). This should seek to include at least one internal and one external system.
If possible the hosted application – such as e-mail, blogging or wiki – would be the overall ‘service’ that customers care about. The underlying infrastructure services – storage, identity, computing, I/O – would be linked through to the customer facing service. This enables ICT to provide an ‘overall health’ status based upon the lower level resource status.
DETAILS/LOCATION OF PRACTICAL DEMONSTRABLE OUTPUT
Details of where code, web pages etc can be found.
Solar Winds
http://www.solarwinds.com/
Solar Winds Live Performance Monitor Product Demonstration Website
http://npm.solarwinds.net/Orion/Apm/Summary.aspx
Solar Winds Forum, download and Support site
http://thwack.com/
Solar Winds Application running on a workstation VMWare session (limited availability)
http://wvddash1:8787/Orion/SummaryView.aspx?viewid=1
username ISS
password showme
DESCRIPTION OF THE WORK CARRIED OUT
Describe how you approached this piece of work, any technologies, tools or techniques that you found useful or tried and discarded. Include any examples that you used for inspiration and any contacts you have made in carrying out the work.
The dashboards shown were created by the Solar Winds Orion Network Performance Monitor (NPM) and Applications Performance Monitor (APM) as this platform allowed for easy creation of custom dashboards. There are other providers in this space such as Up.Time Software who could also have been investigated.
The work carried was divided into three main areas
Good Design, What do we want out of a dashboard?
What we do now v What is available in the market
Does it work well?
Should a brand new wheel be created or try and improve what we have?
How can the data we have now be presented in an easy to read way, so that no matter where the information comes from the dashboard looks the same
Good Design, What do we want out of a dashboard?
The dashboard must show the data in an easily understandable way
Only report on objects that can be modified
The dashboard must be multi layered.
The first layer shows an at a glance of the data
The second layer shows a drill down onto the underlying issues. This can often be best shown by ‘hovering over' a graphic to show what is going on
Finally being able to see the underlying data for a detailed analysis of the issues e.g. as a spreadsheet or 'raw' data
The data must also be able to be printed out or exported so it can be profiled in spreadsheets or other modelling tools.
The dashboard must be configurable both to the person using it and to the data being observed.
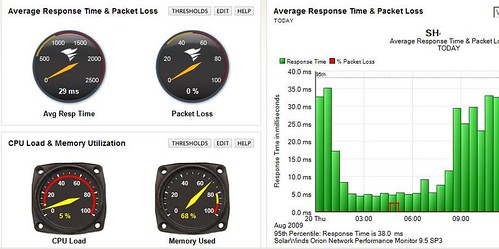
To illustrate this point a virtual server on an 'internal cloud' e.g. a VM server would need a dashboard showing average response time, packet loss, cpu load and memory utilisation. Being able to extrapolate historical trending to show if or when the server will near an overload so that more resources need to be added to the VM.
Graphic to show a dashboard for an internally hosted VM server with 'At a Glance Data'
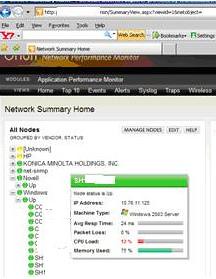
The first 'drill down' would be to hover over one of the items on the dashboard to get a more detailed view.
Graphic to show a Sample Information from hovering over sserver information on a Dashboard
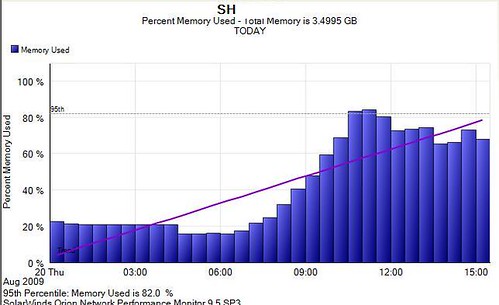
An ability to rapidly create graphs showing trending information so an easy extrapolation of when more resources will be required is also a pre-requisite to a good dashboard
Graphic to show an ad-hoc Graph of Server memory over time
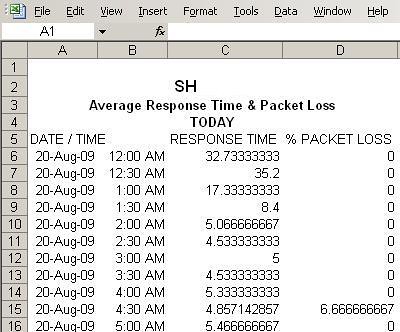
Finally an ability to get to the underlying data and insert this into a table or spreadsheet for a more in-depth examination
Graphic to show Raw Data being extracted from a Dashboard
The above graphics show what might be needed from a server based on the internal 'cloud' That is where the whole system is being monitored and administered by WCC. The information required would be very similar whether the server had been virtualised or was running directly on hardware. Therefore a system would be needed that delivered a uniform approach to servers of this type.
The screenshots here were taken from Solar Winds who provide a customisable dashboard
This dashboard leverages ICMP/SNMP/WMI calls to return status and statistical output into Orion (the Dashboard engine) and its modules.
External Cloud Based Applications and Services
Essentially external cloud based systems can be considered to be one of three types
Application Hosting
Here the provider does nearly all the work for you. You just want an application to run somewhere on a cloud. The provider will deal with the resources required for the application. The service agreement specifies the parameters in which the application will work. Response speed, up time, backup etc.. The cost of the application will generally be a fixed cost for the hosting plus a variable portion depending on the resources required. As more users come on-board so this will increase. Phenomenal rates of increase can be seen for some applications e.g. Flickr as they become popular. A base line to be set so that an application will not scale above a certain value.
This type of application will need a basic dashboard showing fixed and variable costs over time.
An application being hosted on a third party cloud would need minimal interrogation of the infrastructure. The provider needs to deal with that. All we need to know of the application is, is it up? is it responding within acceptable parameters? how much is it costing us to run it?
The provider would have a set of instructions allowing him to add or subtract resources to the app so that it could respond correctly. There would be maximum levels for resources so that the costs do not rise too high. The report for a hosted app would give historical and moment by moment costs.
If the app was for example a hosted web-site the Orion system has Generic Web server monitors. These templates test the ability of a web server to respond to HTTP and HTTPS requests. These would give an accurate view of the health and responsiveness of the web-site and have the same dashboard 'look and feel'.
Examples of hosted applications could be Wordpress or just data storage itself.
O/S Hosting
In this case a provider sets up the server environment e.g. a Windows 2008 server or a Linux server and then we add ourselves whatever services e.g. IIS we require to the environment. The monitoring of the environment is now much increased as we need to measures the strains induced by the stresses on the server as well as the response of the service we have added. This type of hosting is rare. The hosting found is generally for web sites so really lives in the Application hosting arena above. In reality the closest to this type of hosting is where a supplier provides an 'off-the-shelf' server which you add to as in the Amazon EC2 package. The detail of this approach has been added into the following section.
Baseline Services
Here the cloud is just the infrastructure itself and we install whatever servers and services we need. This is pretty analagous to the internal cloud where we already have a high degree of monitoring and understanding of the background processes.
A provider of this type of system is Amazon EC2 who basically allows you to pick and run an off-the shelf Windows or Linux server and add the services you want. If you cannot find the exact match you can effectively create a private server from scratch.
In this case we need to see what is going on so that the appropriate action can be taken. The standard approach of ICMP/SNMP/WMI calls are unlikely to work as they will not be provided by the supplier. Rather an API or range of APIs will be provided. The Solar Winds Orion engine can then add these as ‘External’ devices and you can then apply Application Performance Monitors (APM) monitors to them in the same manner as 'standard' devices.
Amazon EC2 allows for Auto Scaling
Auto Scaling allows for a pre-arranged change to happen at different levels of stress on a server setup. First of all the server array has a load balancer in front of it. Then at pre-defined levels it will add or subtract similar servers to the array. A minimum base line of servers can be setup as can a maximum and latency to allow for momentary peaks to iron out and not cause an un-needed server addition. So with auto-scaling the environment 'looks after itself' but you do need monitoring so that you can check that it is working as designed.
Another approach is that from Elastic Hosts Here the approach is as the name implies more elastic. You can change the amount of RAM, CPU or hard disk space to the server on the fly. Elastic Hosts allows for a monitoring via the web or by APIs. So again the Orion Dashboard could be used to show a similar interface with the internal cloud. The need to monitor here in a rapidly changing environment would be greater than in the Amazon EC2 as there is not a defined auto scale path. You monitor rhe environment and make what changes you think are necessary.
What we do now v What is available in the market
In-house reporting of Network and server issues is implemented by NAGIOS. This is a ‘free’ system provided under a copyleft agreement. The advantage of this is that there is no software licensing cost but as a result there is no way of being able to demand solutions to issues from the software provider/reseller. It is of course possible to deal with partners who can help to support your environment such as Groundwork Open Source With NAGIOS however in general a lot of input is required to create customised dashboards. As a result other providers of dashboards were considered. The Solar Winds offering was used as they provide many off the shelf dashboards plus a customisable interface for creating your own design. There is also a forum where users can place their own home grown options. Solar Winds also provide an 'easy' upgrade path from NAGIOS to their own proprietry and definately chargeable option. Solar Winds 30 day trial option was used to investigate how their software could be used by WCC.
PROJECT OUTCOME
Describe the degree to which the work was successful in addressing the project description. Include reasons why or why not.
The work carried out showed how an off the shelf package could be used to interrogate the internal services quite easily.
The allied forum had many examples of templates and reports created by the user community and there was assistance from the suppliers to create custom dashboards etc.
Work on external clients was more difficult but work on the hampered by the need to get the relevant information from providers. This is ongoing and it is hoped this will be provided in the future.
wip
Overviewing the cloud structure showed that having third party providers do the work for us reduces significantly what we need to do to keep service running. Handing over the running of hardware and operating systems to third parties which specialise in these processes leaves our teams able to spend time on research of new systems i.e. using their expensive specialist skills to the maximum instead of firefighting low level problems which lower skilled people could do. Hiving these out to third parties will reduce costs
SHORT TERM BENEFITS
What immediate impact could the output of this R&D work have on the organisation – could it provide benefits without compromising our strategic approach?
wip
investigate clouds for app usage fast start, completely quantifiable costs, fast stop, pay for what you get,
One of the issues found with R&D and Proof of Concept Work at WCC is that it can be difficult to source the appropriate hardware. Generally old hardware can be sourced such as retired NetWare servers with internal hard disks e.g. HP Proliant DL 380 servers but 64 bit architecture kit is hard to come by. So where a test environment on the latest hardware is required for a short period a hosted package could be ideal. Elastic Hosts and Amazon EC2 allow for a quick turn around on server production. The costs are clear from the outset so you can track them easily.
One downside is that if you already have a server farm and agreements with O/S providers such as Microsoft you can pay twice for server licensing. Amazon will not accept your internal server licwensing and you have to 'rent' one or more of theirs.
Although the providers make out using their services is as easy as using a hot drink vending machine it turns out there is quite a lot to learn. The interfaces they use are all proprietary so moving between suppliers means different skill sets need to be acquired. So production of a unified dashboard would go some way to dealing with the problem of measuring the outcomes of load on their devices. However the real problem especially in R&D and Proof of Concept is not measurement but quick production of the test kit.
So in conclusion a Web Services Management Dashboard has some things to commend it.
It allows for an easy to understand interface which will change depending on what is being viewed. So for a real server in WCC or a virtual server in the private cloud the dashboard would be created with snmp calls as with NAGIOS or the Solar Winds offering. Servers or applicarions in the cloud could have a mixed interface using metrics showing the service standing up to external load as per a web server responding to hits and a more responsive API interface showing whether new servers for load balancing are required. This would help to de-skill the monitiring process allowing the more skilled staff time to use their time on more productive work.
The downside is that setting the dashboard up will require a fair input of time and testing and would not be worth the candle for R&D purposes. However if we move to the cloud for outsourcing servers and applications then the time may be well spent.
IP allocation work o/s firewall
STRATEGIC IMPLICATIONS
How the work carried out fits with our strategic direction or how it should contribute to our strategic thinking.
wip
Strategy for data storage in cloud, split between providers cf RAID, encryption,5*9 costs uptime


